Poor deliverability
Campaigns like a Black Friday sale landed in spam or never arrived, and users often had no idea why.
Selected work, by invitation.
Enter the portfolio password to view this project.
Back to selected workAI insights · Email marketing
Turning an opaque email health report into a clear score and useful next steps. A short internal R&D sprint that was added to the following quarter's roadmap.
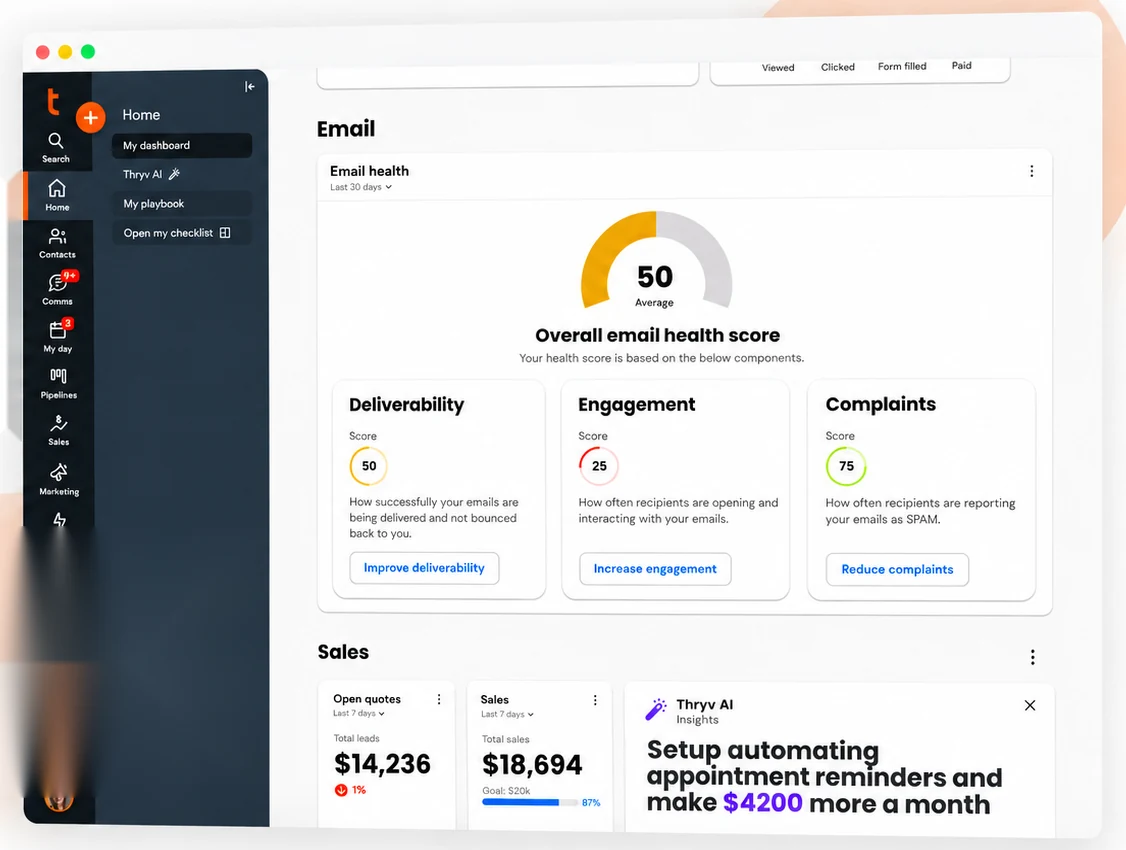
I used six user interviews and competitive research to design the widget, report, and assistant concepts. In a workshop with product, research, content, and customer success, we narrowed the scope to helping users understand problems and take action. It started as a short internal R&D sprint, was picked as one of the top 3 of 36 projects, and was added to the following quarter's roadmap.
Problem
Keap is an all in one CRM for small business owners, acquired by Thryv in October 2024. Many of them run their marketing through Keap email. Campaign suspensions, unclear bounce warnings, and manual list cleanup left them dependent on support. The existing experience scored 48.8 SUS in baseline testing.
Campaigns like a Black Friday sale landed in spam or never arrived, and users often had no idea why.
Most users did not know their email health status until something broke.
Even when users saw a problem, they did not know what to do about it.
Deliverability questions filled the support queue.
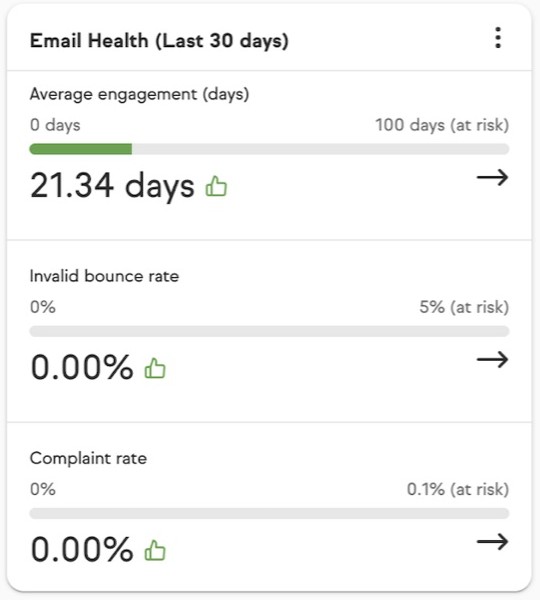
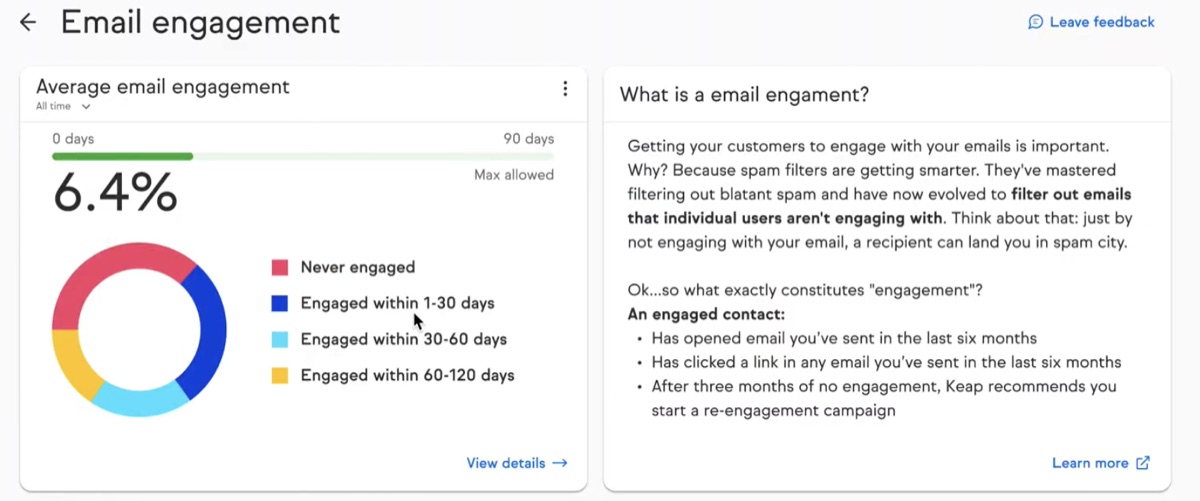
The dashboard widget and the engagement report, before the redesign.
 12
 435
“Average engagement (days)” and “Invalid bounce rate” meant little to a small business owner.
21.34 days or 0.00% did not say whether things were good or bad, or what to do.
The side panel explained engagement in paragraphs instead of telling users what to do.
A single snapshot, so users could not see whether email health was getting better or worse.
“Learn more” led to a general article, not steps for this account.
The contact list had the same problem: it was overwhelming, with no sense of who mattered.
Research
I looked at product analytics, benchmarked competitors, interviewed six users, and ran a design thinking workshop with product, research, content, and customer success.
Fewer than 10% of users had adopted Email Health. Deliverability tickets were high, and few people took action from the reports.
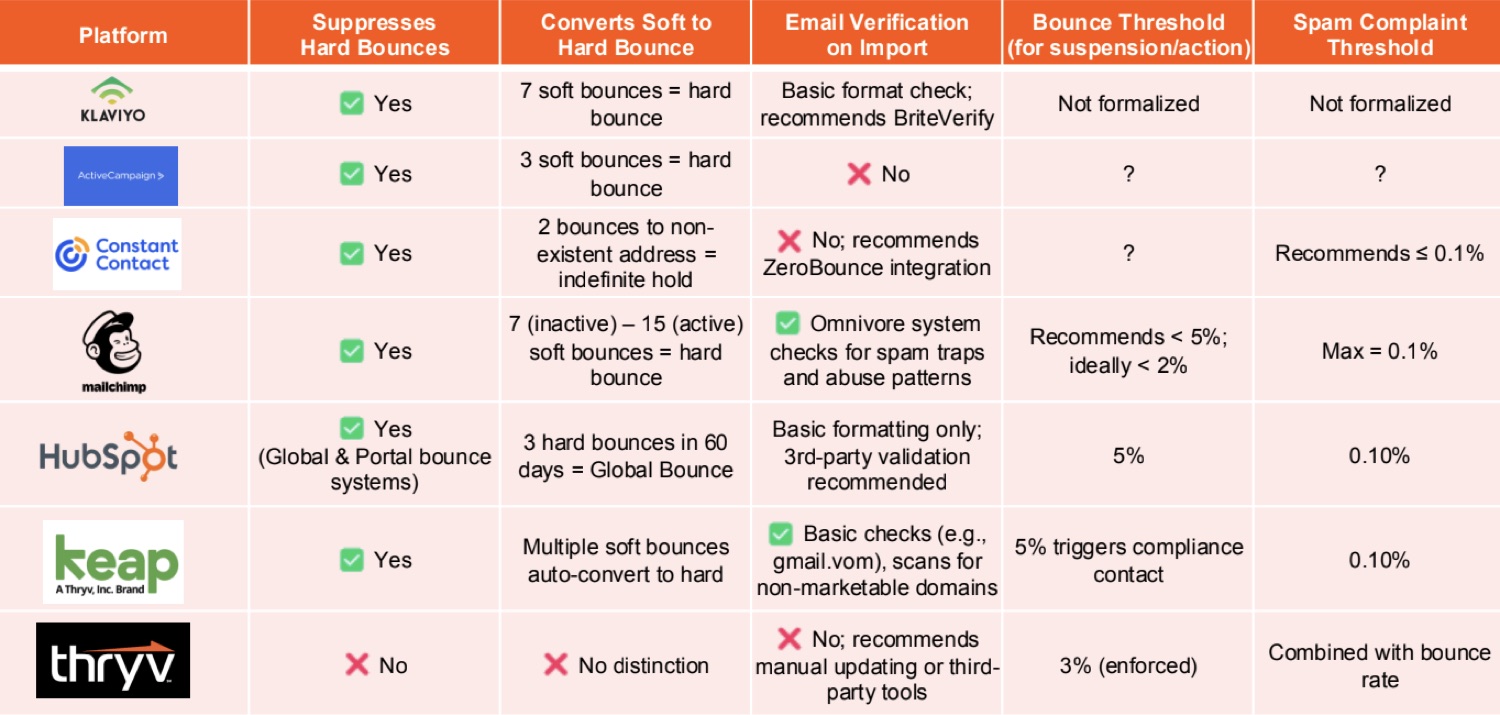
Other tools paired a simple score with deeper analytics. None of them guided users with AI, and that was the gap.
I talked with six users about reporting and deliverability.
What we heard. Users wanted earlier warnings, reporting they could understand, and specific steps to fix bad contacts instead of trial and error cleanup. One put it simply: “I wish the system gave me a heads-up.”
I ran a workshop with product, research, content, and customer success to agree on the pain points, explore directions, and balance quick UI wins with the long term AI vision.
The questionHow might we use AI to make Email Health clear, human, and trustworthy, while lining up with Thryv 2.0?
Make the score explainable, and put the next step right next to the problem.
Process
The workshop focused the MVP on insight, guidance, and control.
Use a 0 to 100 score as an entry point, then explain what contributes to it rather than leaving the number on its own.
Deliverability explains inbox reach, Engagement explains recipient interaction, and Complaints explains negative feedback.
Pair warnings with cleanup or improvement actions so users can respond without leaving their day to day CRM work.
I wrote structured prompts using the ACTC format for research and design work. It made research and synthesis faster, kept the AI guidance focused on trust, and cut down guesswork so we could decide sooner.
There was no data yet to measure any of it during the sprint, so these are what we would track after launch.
More adoption and repeat use.
More actions taken from AI insights.
More engagement, fewer bounces and spam reports.
Fewer email health tickets.
Product Design
The widget gives an at a glance view. The report adds category breakdowns, trends, and recommendations for a deeper look.
The first thing users see, before and after the redesign.
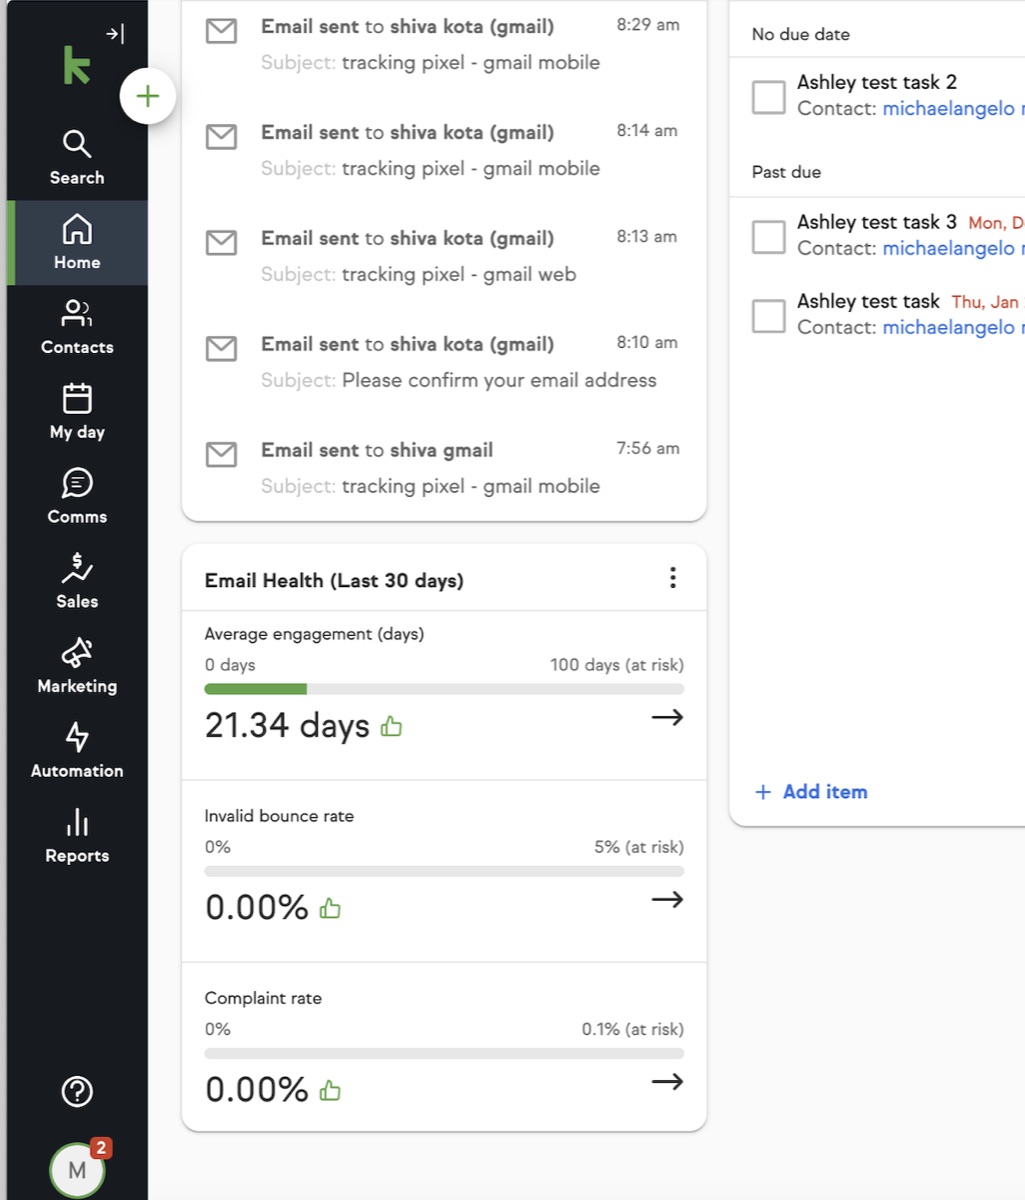
Ambiguous metrics and weak hierarchy made it hard to judge health or know what to do next.
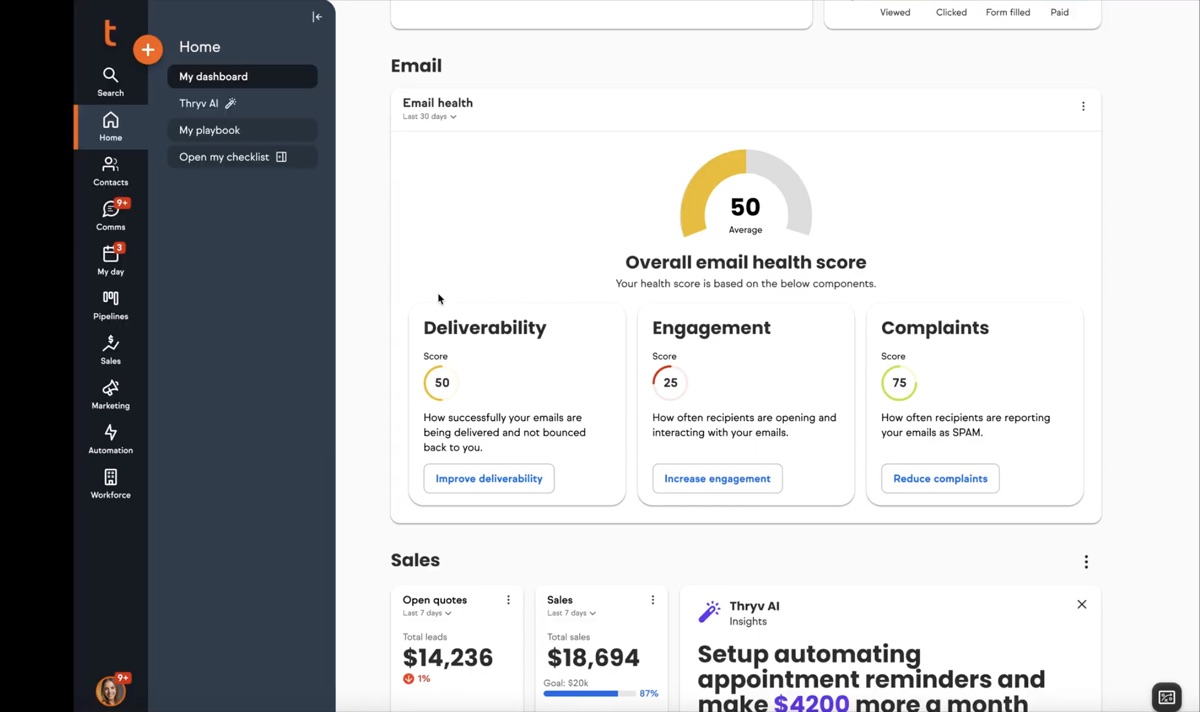
Key metrics are grouped, and the actions to fix them sit right beside them.
Where users go to understand what is wrong.
Text heavy explanations and buried actions made the report hard to use.
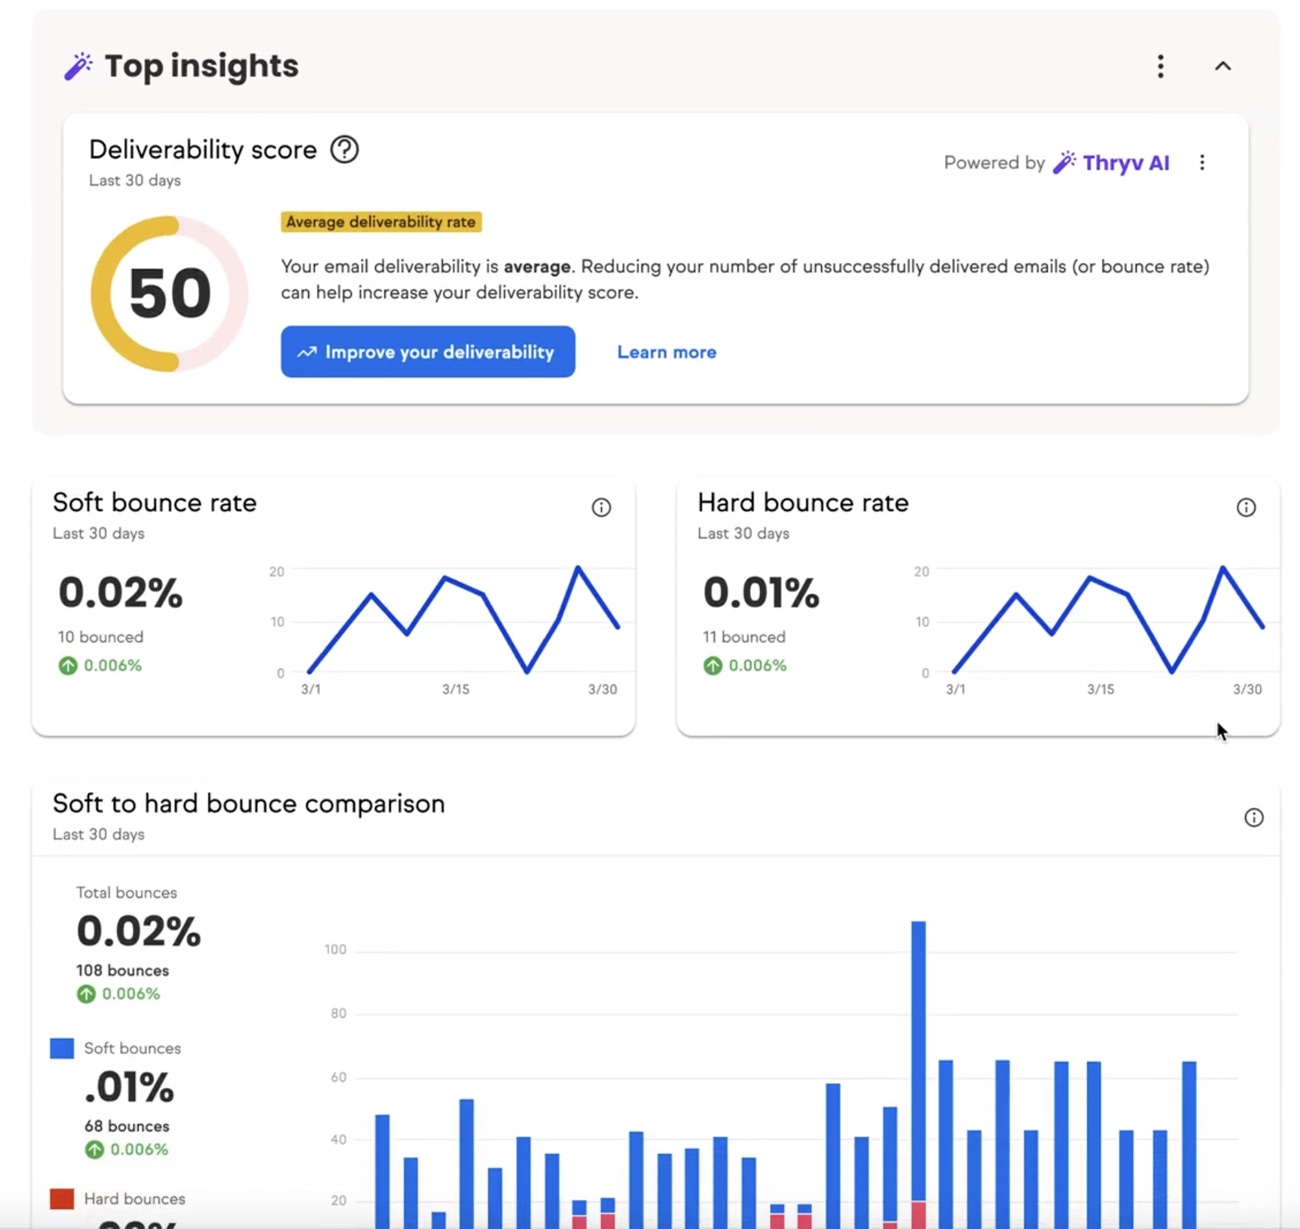
The score is prominent, with trends, bounce breakdowns, and AI guidance.
A prototype walkthrough of how the health information and recommendations fit into the CRM.
The full flow inside Keap: from the email health widget on the dashboard into the deliverability and engagement reports.
What 5 users said about the redesign
“I love the score... it’s the first time I’ve understood my email health at a glance.”
“I get the numbers… but I need someone to walk me through what to do.”
Explored AI that guides the next step, from a side panel to an agent that does the work.
What we learnedThey did not need more data. They needed AI to guide their next step.
From answering questions to doing the work.
The side panel answers questions about email health based on the current data.
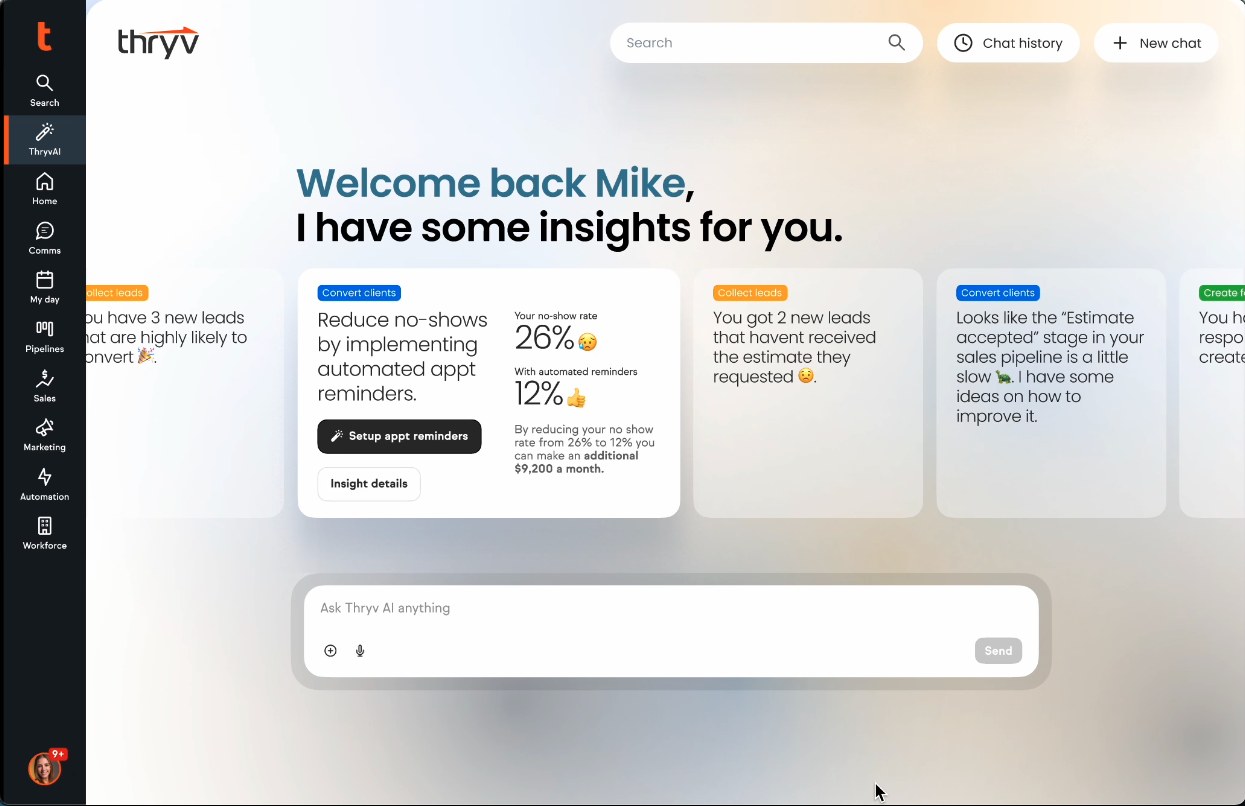
The homepage greets users with insights, like leads likely to convert or no shows that reminders could fix, each with one action to take.
Users ask for a cold leads email in plain words. The agent drafts it, waits for approval, and sends it at the best time.
Results
A second round of moderated testing with 5 small business owners checked clarity, trust, and whether people could act on what they saw.
Out of 36 internal R&D projects.
Added to the following quarter after the sprint.
Small business owners in moderated testing.
The existing experience, before the redesign.